

Features
Advanced mapping, in a simple one-page application.
The tools operations rooms use every day, from the first spot on the map to the briefing at the end of the shift.
Your structure
Built around how you work.
Create the categories, groups and types your organization thinks in, each with its own shape and colour.
-
Custom categories, groups and types
Create a category for anything you track, then groups and types under it. Each category is either time based (incidents and reports that follow your date filters) or static (sites and assets that are always on the map).
-
Shapes, colours and labels
A category picks the shape, a group its fill and border colours, and a type a short label of up to two characters. Every spot is recognisable at a glance.
-
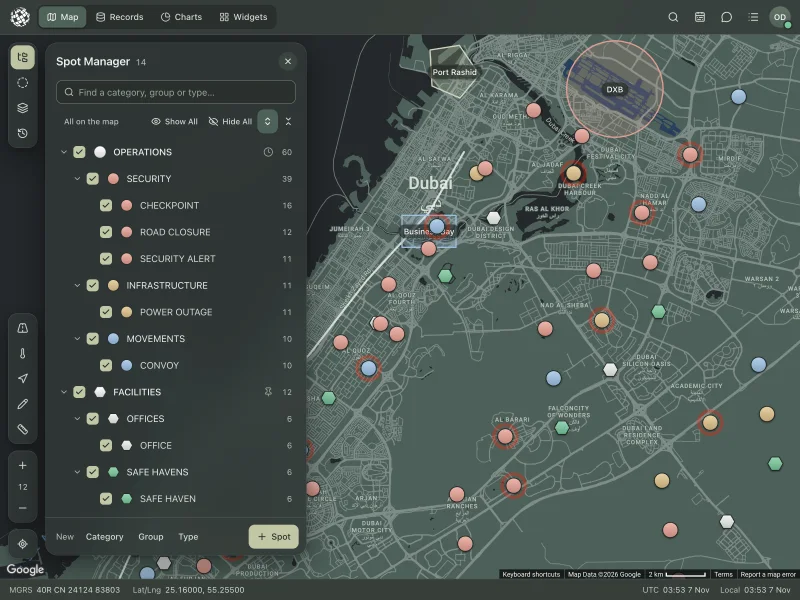
Spot Manager and filter
One tree shows your whole structure with live counts. Tick to show or hide any branch, search it, or Show All and Hide All in one click.
Map styles
Fourteen ways to see the ground.
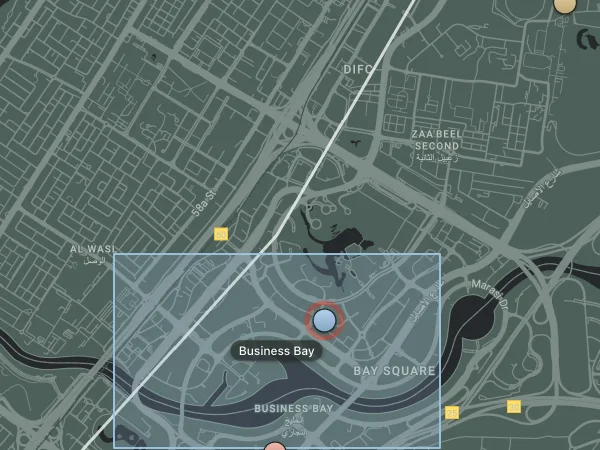
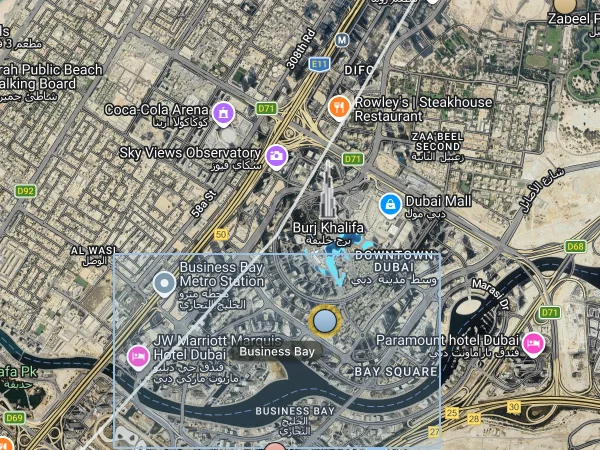
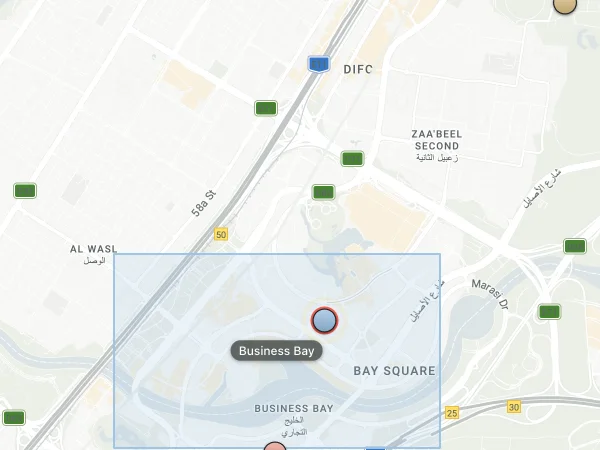
Twelve styled maps, from Military Colors to Porcelain, plus Satellite and Terrain, with place and road names on or off. Your choice is saved to your account.
-
 Military Colors
-
 Satellite
-
 Porcelain
-
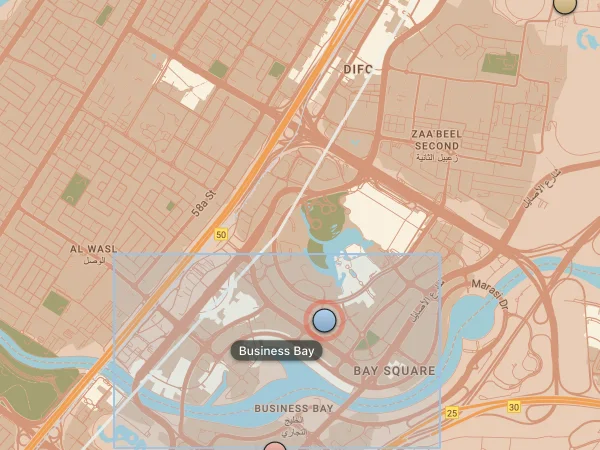 Desert
-
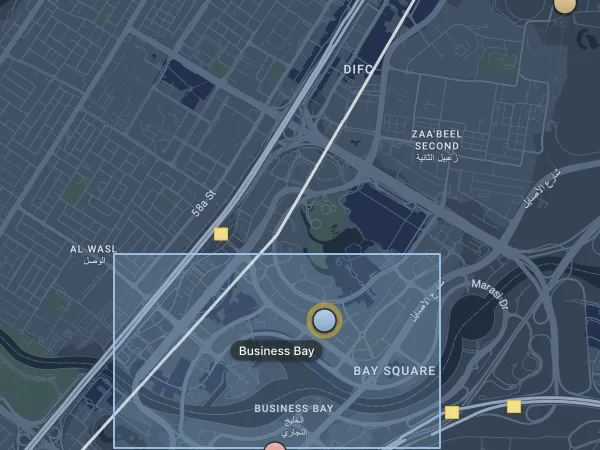 Slate Blue
-
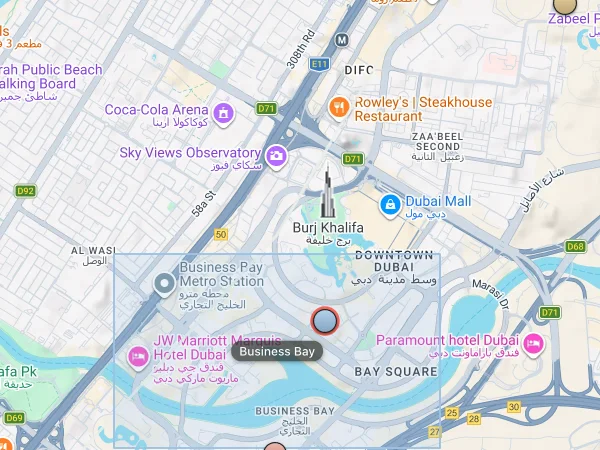 Terrain
Plot and assess
Every report, weighed and shared.
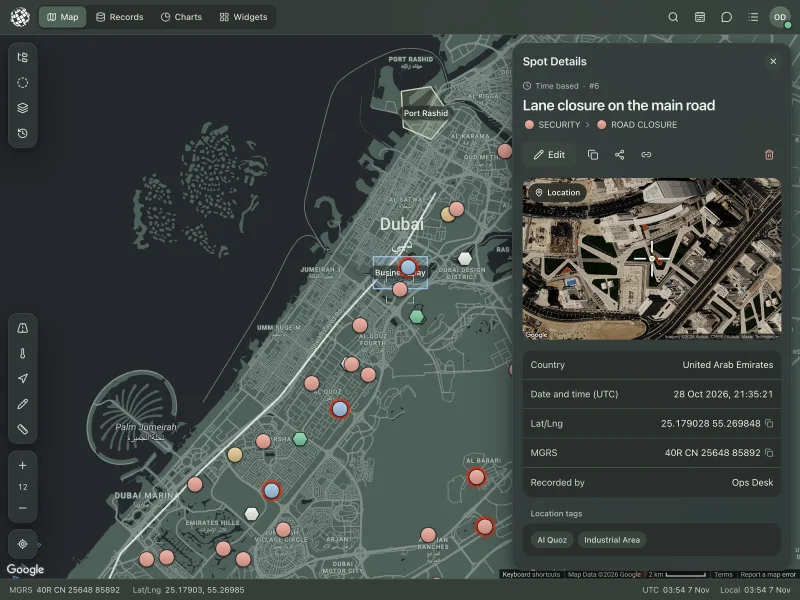
Right-click the map to add a spot. Its country, grid reference and place names fill in by themselves, and everyone sees it the moment you save.
-
Add a spot easily
Click the map, right-click and choose Add New Spot, or paste a copied spot. Country, MGRS and location tags fill in by themselves, and Now stamps the current time.
-
Assessment built in New
Rate each report by impact level (ILI 1 to 9), source reliability (A to F) and information credibility (1 to 6), so everyone reads it with the right weight.
-
Images and PDF files
Drop up to six photos or PDFs on any spot, such as a site's security and evacuation plans. Images open as a slideshow in its details.
Areas and geofences
Draw the lines that matter.
Mark out areas of interest, routes and no-go zones, keep them in groups, and know the moment someone crosses one.
-
Draw and customize overlays
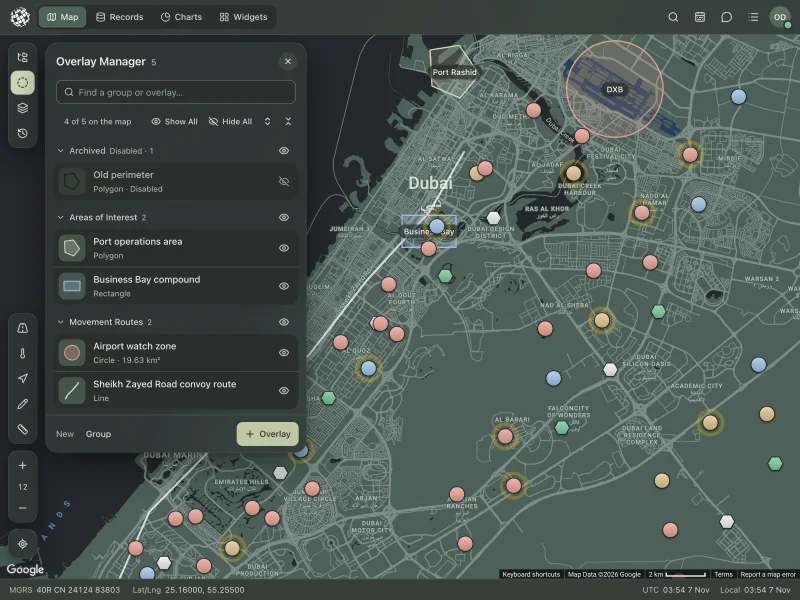
Draw circles, rectangles, polygons and lines, with their own fill, border, opacity and on-map label, and guidance at every step.
-
Overlay Manager
Keep overlays in groups, find any one by name, show or hide it, or disable a whole group for every user at once.
-
Geofence alerts New
Turn an area into a geofence and get an alert when an assigned person enters it, leaves it or goes over a speed limit inside it.
-
Measurement tool
Measure distances point by point, and see the area of any overlay you draw, for example a search area, at the touch of a button.
Search
Find it by place, area or road.
Go straight to a place or a grid reference, draw an area to see what is inside it, or check a road before anyone drives it.
-
GEO Search
Go to a place by name, by latitude and longitude or by MGRS grid reference.
-
Geo shape search
Draw an area and see every spot inside it at once, counted by group and date.
-
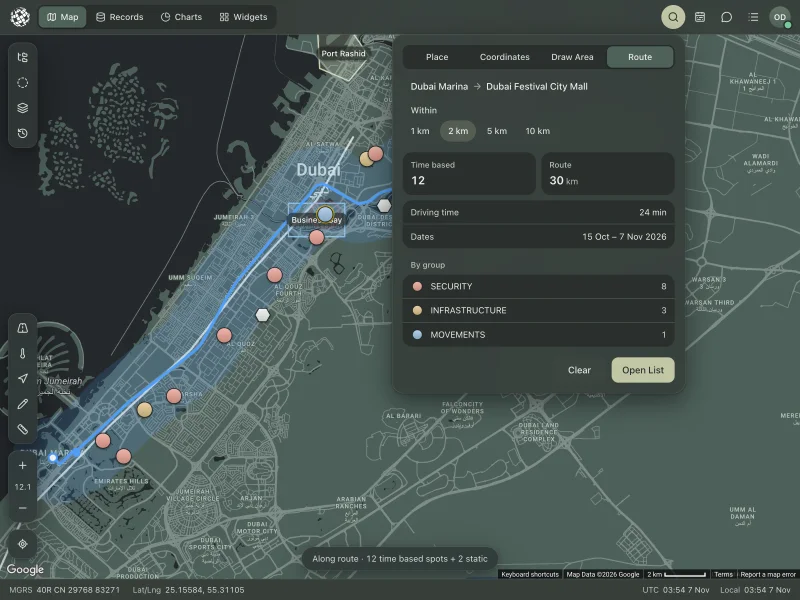
Route Check New
Enter where a journey starts and ends, and see every incident within 1, 2, 5 or 10 km of the road, with the distance and driving time.
-
Date range filter
Today, the last 7 or 30 days, or any range on the calendar. Time-based spots follow it while static ones stay put.
Your team
Know where everyone is.
Positions arrive from the mobile app as people move, and every route stays on record for 30 days.
-
Track users in real time
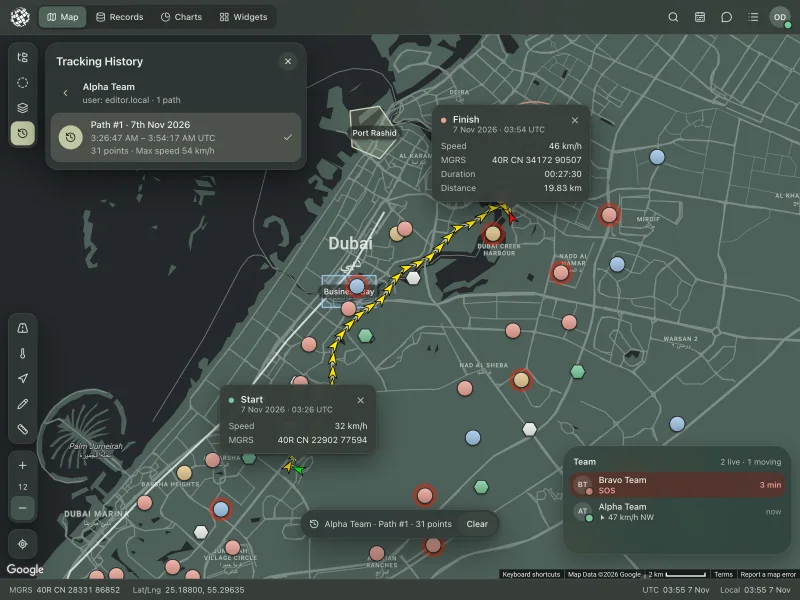
See your people move on the map from the mobile app, with their speed, heading and grid reference.
-
Tracking history
Replay any device's paths from the last 30 days, with times, points and top speed.
-
SOS that can't be missed
An SOS from the field sounds an alarm, turns the top bar red and shows who needs help and where.
-
Real-time notifications
Every new or changed spot and overlay reaches every user instantly, with a sound and a message, and the map updates itself.
Records and charts
From the map to the briefing.
Every spot in one searchable table, and charts that turn a year of reports into a picture you can print.
-
Spots database
Search every spot your account can see in one table, by title, description, country, location tag, structure and date.
-
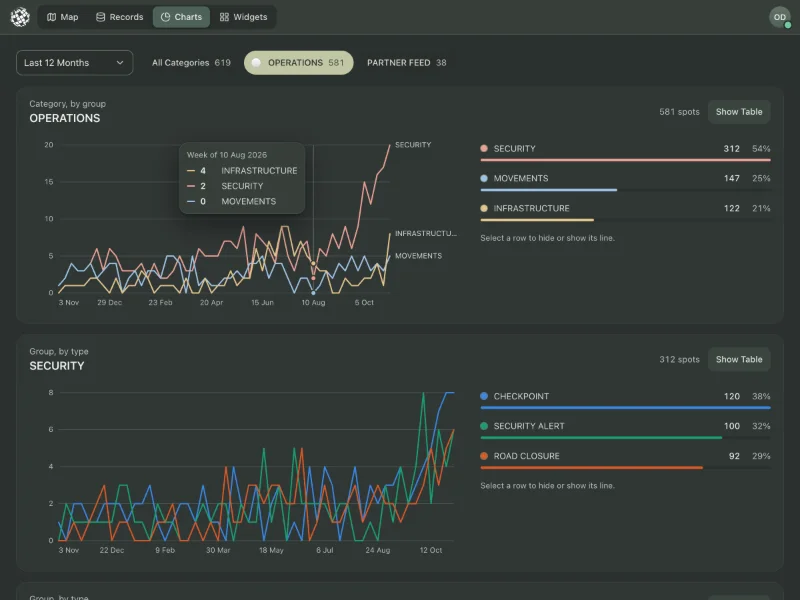
Visual reports
Chart time-based spots over any range, by category, group and type, with the busiest day and the largest category, and print the report.
-
Spots heatmap
Turn your filtered spots into a heatmap to see where activity gathers.
-
Export spots as CSV
Download the spots on your map as a spreadsheet, with title, description, structure, country, location tags and date.
Widgets
What you watch, right on the map.
Small cards on glass over the map. Pick the ones you need, drag them where you want them, and they stay with your account.
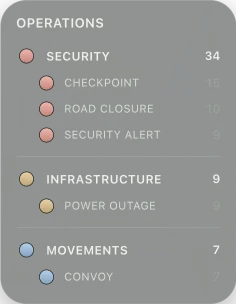
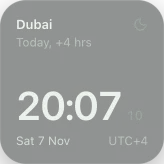
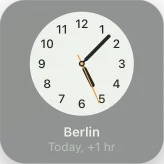
-
World Clock New
The time where your teams are, digital or analog, with a face that turns dark at night.
-
Legend New
Your category's groups and types with their shapes, live counts and only the active ones if you like.
-
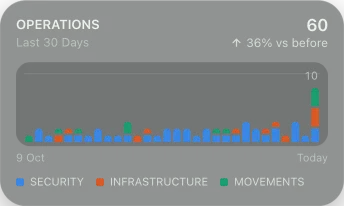
Chart New
A total, trend, columns or breakdown for the last day, week, month, quarter or year.
-
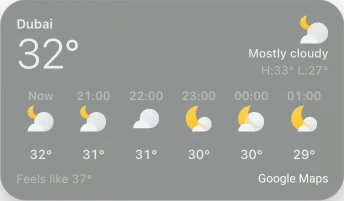
Weather New
Conditions and the days ahead at the map's centre or any city, in Celsius or Fahrenheit.
-
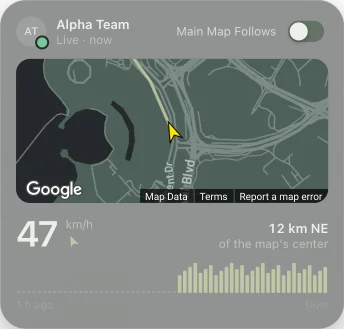
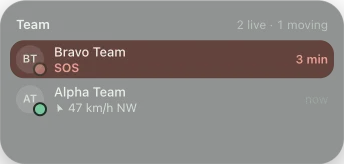
Team and Follow New
Who is live and moving, SOS first, or follow one person on a map of their own with their last hour.
Mobile app
The field, on the same map.
OPSMAPIA for iPhone and Android puts your people in the field on the operations room's map.
-
Mobile app for iOS and Android
Send messages and photos, report a location, call SOS and share your live position with the operations room from the field.
-
Messages, location reports and SOS
Messages, location reports, SOS calls and geofence alerts in one place, searchable by person, kind and date.
-
Location with permission
People share their position only with their permission, and positions are kept no more than 30 days.
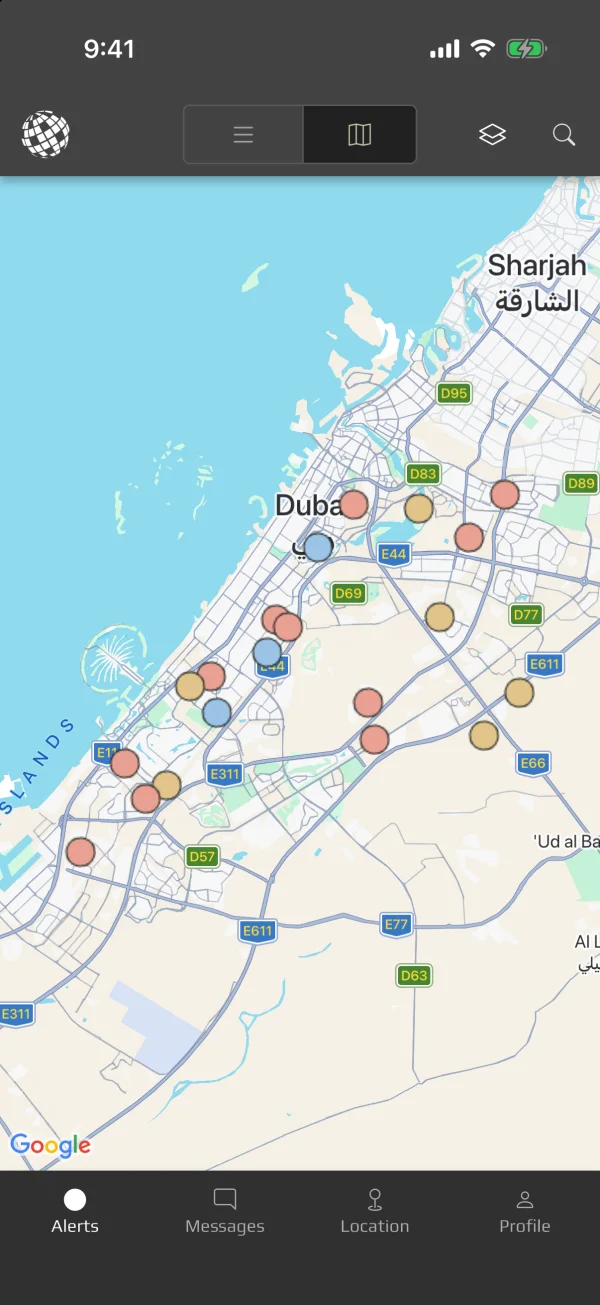
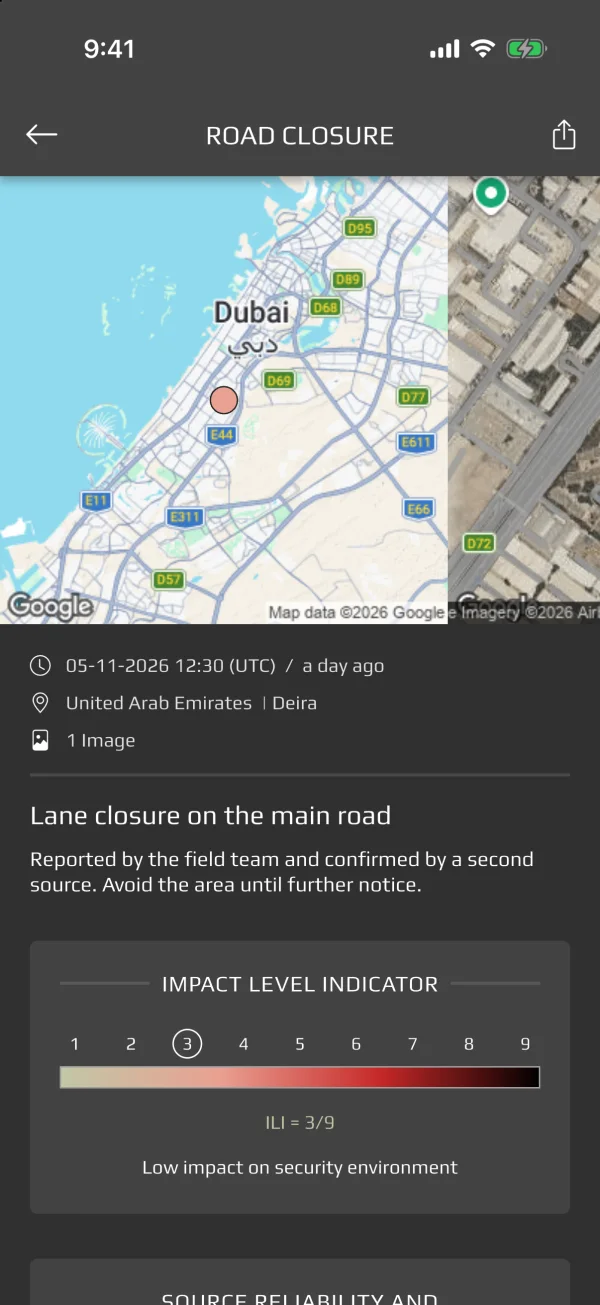
Screens show the OPSMAPIA app with sample data.
See it working on your own area.
We'll walk you through OPSMAPIA with your structure, your map and your team.